|

|
|
Arabi Gin
Cotton 'Links'
Market Data
News
Weather
Market Alerts
Resources
|
How Bullish Is Sugar Here?
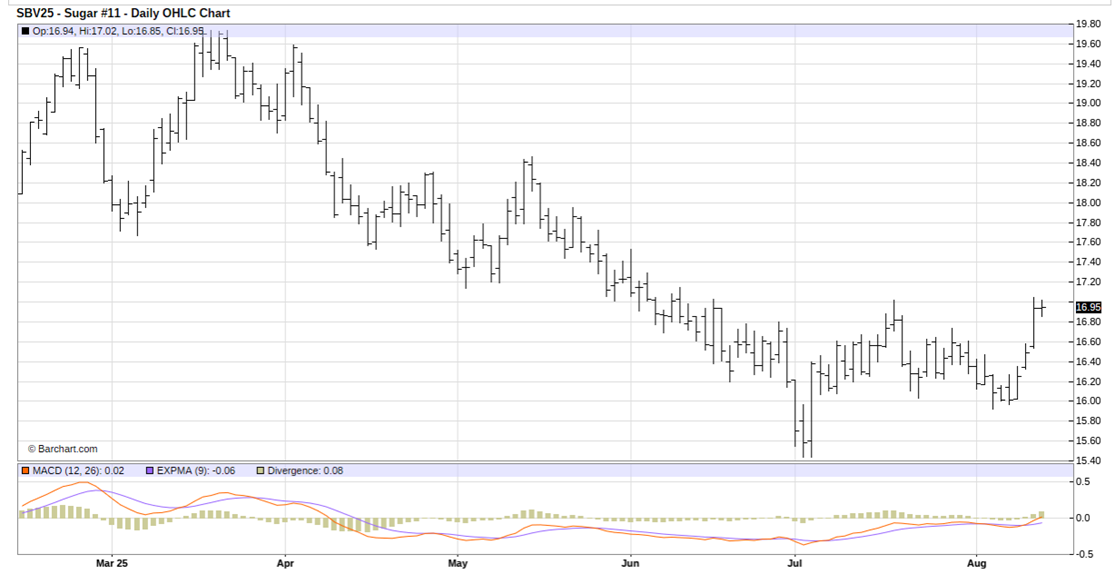
October sugar futures (SBV25) present a buying opportunity on more price strength. See on the daily bar chart for October sugar futures that prices have just hit a two-month high and are starting to trend higher again. See, too, at the bottom of the chart that the moving average convergence divergence (MACD) indicator is also in a bullish mode, as the blue MACD line has just crossed above the red trigger line and both lines are trending higher. The sugar bulls have the overall near-term technical advantage. Fundamentally, sugar prices have been rising due to reduced global production and better global demand. Droughts in major sugar-producing regions like India and Thailand have reduced sugar crop yields. A move in October sugar futures above chart resistance at this week’s high of 17.05 cents would give the bulls more power and it would also become a buying opportunity. The upside price objective would be 18.50 cents, or above. Technical support, for which to place a protective sell stop just below, is located at this week’s low of 16.32 cents.  IMPORTANT NOTE: I am not a futures broker and do not manage any trading accounts other than my own personal account. It is my goal to point out to you potential trading opportunities. However, it is up to you to: (1) decide when and if you want to initiate any trades and (2) determine the size of any trades you may initiate. Any trades I discuss are hypothetical in nature. Here is what the Commodity Futures Trading Commission (CFTC) has said about futures trading (and I agree 100%):
On the date of publication, Jim Wyckoff did not have (either directly or indirectly) positions in any of the securities mentioned in this article. All information and data in this article is solely for informational purposes. For more information please view the Barchart Disclosure Policy here. |
|
|